Tag Archives: debugging

debugging with xCode (pt 5) – conditional debugging

Conditional

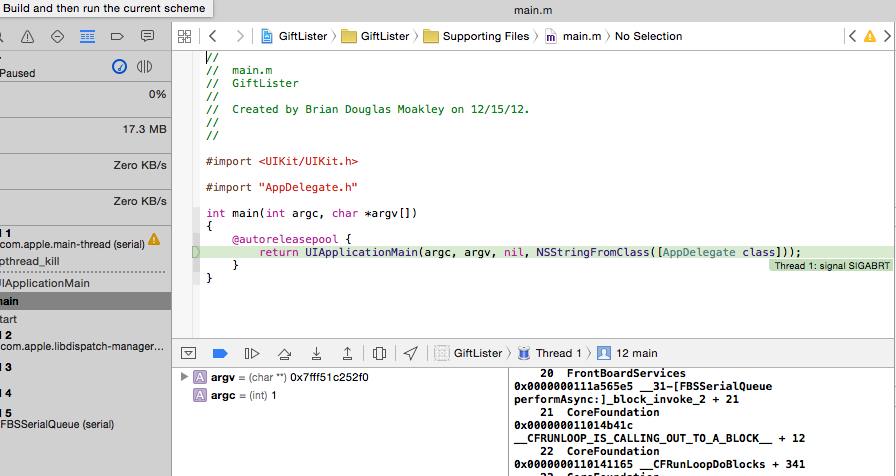
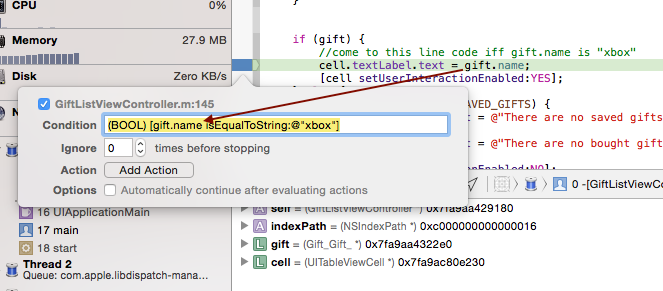
As you’re debugging your app, it may take in user input, for example, a gift name that’s a string.

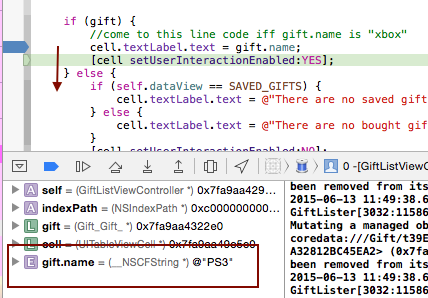
Hence, code wise we want to say “if gift.name is equal to ‘xbox'”.

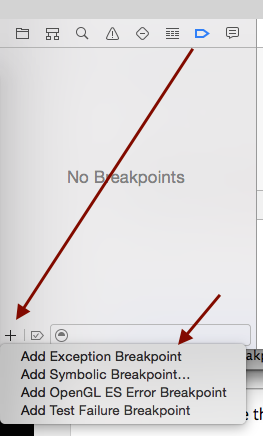
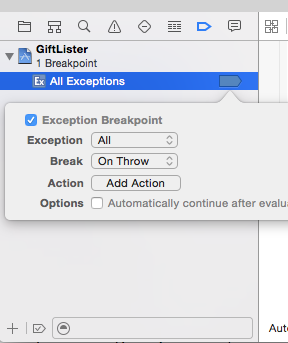
If you want to break whenever this string is equal to say “xbox”, you can do so using conditional debugging.

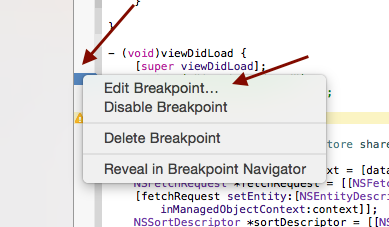
Edit the breakpoint and at the Condition textbox input the code:

The expression must evaluate to something so we simply cast it to BOOL.

Now, if you were to go back to your app and input xbox into the gift.name textfield, the runtime compiler will break to this line.
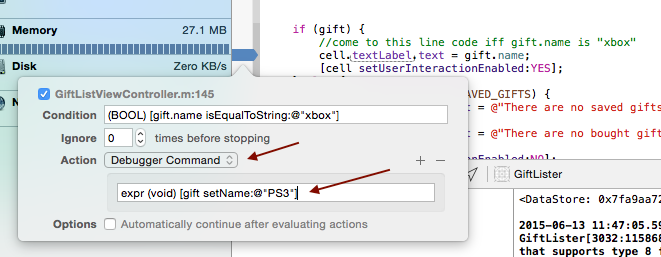
set

So now that the user have just entered “xbox”, we reach to this breakpoint. Let’s say we want to set this variable to something else instead, say “ps3”.

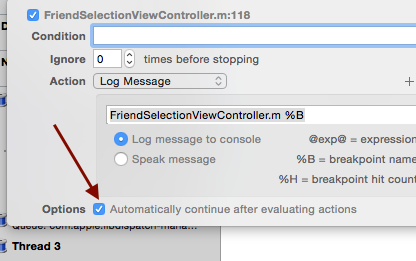
You simply add in an Action with the Debugger Command and insert the expression:

Again, we’re telling the debugger this is an expression and thus must evaluate to something. Since its a set command, we just cast it void.

Therefore, we’re basically saying if the user enters a string gift.name that matches “xbox”, we want to change gift.name to “ps3” instead.

debugging5_set_condition

use the code’s setter method to set gift.name to ps3 in Action >> Debugger Command‘s textfield

debugging5_action_after_condition

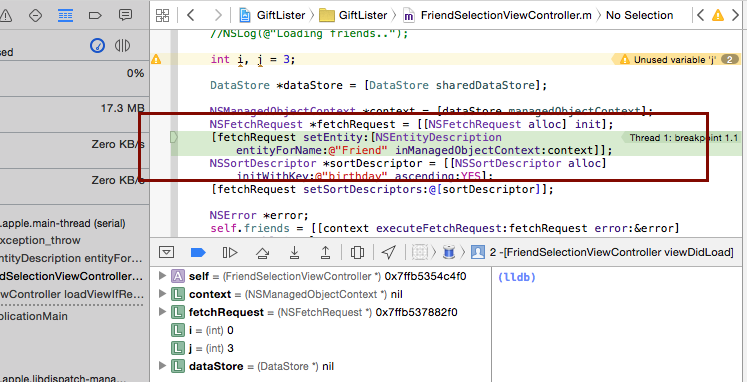
Now when you start the app and input “xbox”, it’ll jump to that breakpoint. While the program is paused, in your variable section, right click and select “Add Expression”. Put gift.name.

debugging5_evaluate_expression

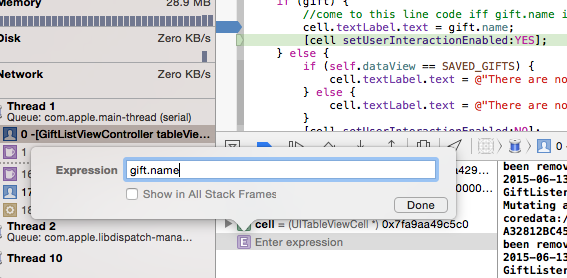
Then, have the debugger step down 1 line (fn + F6) so that you process the line of code. In your variable section, you will see that our expression gift.name was indeed changed to “ps3”.

debugging5_changed

debugging with xCode (pt 3) – Logging with break points

Logging with Breakpoints

Say at a certain line in your code, you want to log some statements. You do so by first adding a breakpoint by clicking on the vertical strip of space on the left side of your source file. Then you right click on your breakpoint and select ‘edit break point’.

debugger3_edit_brpt

For option Action, select Log Message and type in some message you would like to appear. For example, the name of the file would be a good choice. Also, the name of the method you’re in is also another great choice. You do so by using %B.

debugger3_log_msg_console

You can also log custom variables by putting variables in between %%

debugger3_logging_variables

Now, execution will stop at your breakpoint and print out your log messages

debugger3_stops_at_brpt

However, say you want the execution to keep going. You’d check the “Automatically continue…” checkbox so that you get the logging and all that, but execution continues.

debugger3_brpt_continue

Now it just uses your breakpoint to do whatever Action you intended and continues on to the next one.

debugger3_continues

Voice Logging

Next to Action, there is a + and button. Use the + button to add more actions. Select Log Message and there is a Speak Message option. Select it and it will voice your logs.

Debugger Command

Add a breakpoint on a line right beneath a variable say:

Control click or right click the breakpoint, click ‘Edit Breakpoint’, then select select “Debugger Command” from the dropdown. In the text field type the follow:

po is a debugger command that will print out the contents of an object. You can keep adding Actions >> Debugger Command and po-ing variables.

Logging with Date

Action >> Debugging command

The expr command will evaluate an expression in real time. The expression command needs to know the actual type of the returning value, so a cast is necessary. Since there is no return type for NSLog, the return type is cast to a void value. Build and run.

You should now see the following:

2012-12-20 08:57:39.942 GiftLister[1984:11603] dataStore:

Being able to add NSLog messages via. breakpoints means you no longer have to stop the program just to log important data, there’s no chance of introducing new bugs because you are not touching the code, but best of all, there’s no last minute scrambles to remove all your debug statements the night before release.

Disabling breakpoints before a release

Say you’re ready to turn in a release and you want to disable all the breakpoint logging. Simply go to your navigator and press the debug section. Then select ‘Disable breakpoints’ and that’s it. Now your code will run without all the breakpoint logging.

debugging3_disable_brpts

debugging with xCode (pt 2) – stopping at exceptions

Stopping at Exceptions

By default, when you run into an error, you’ll get a SIGART error that really does not tell us anything.

debugging2_SIGART

Currently, you cannot see the source of the compile error. To find it, you need to add an exception breakpoint to track down the source of the error.

So switch to the breakpoint navigator as shown below

debugging2_on_exception_throw

The Exception field gives you the option of activating the breakpoint in Objective-C, C++, or All. Keep the default option of All.

The Break field in the dropdown allows you to pause execution on whether an error is thrown or caught. Keep it selected on thrown. If you are actually making use of exception handling in your code, then select ‘On Catch’. For the purposes of this tutorial, leave it ‘On Throw’.

debugging2_exception_brpt

Now you’ll be able to see where the error occured.

debugging2_error_src

debugging with xCode (pt 1) – showing variables

Showing Variables

Your debugging console can be toggled by the middle button on the top right hand corner. Mainly, it shows your variables, and log outputs.

debugging_toggle_console

When you run and debug a project by throwing in breakpoints, you’ll see that your debugging console only has log outputs like so. There are no variables…you only see your output console.

debugging_no_variables

In order to have the variables showing, go to:

xCode >> Preferences

debugging_xcode_pref

and you should see and select Behaviors. Then you will see panels for Build, Testing, Running….

Under Running, select Start and on the right hand side select Variables and Console for debugger showings.

debugging_behaviors_start

Do the same for ‘Pauses’ and ‘Generate Output’.

debugging_behaviors_pause

debugging_behaviors_output

The ‘Variables & Console’ option tells the debugger to show the list of local variables as well as the console output each time a debugger session starts. If you wanted to view just the console output, you would select ‘Console View’. Likewise, if you wanted to see just the variables, you would select the ‘Variable View’.

The ‘Current Views’ option defaults to the last debugger view on your last debugger session. For example, if you closed Variables and opted to just the view the console, then just the console would open next time the debugger was started.

Now, you will see the variables appear when you debug

debugging_variables