Task 1:
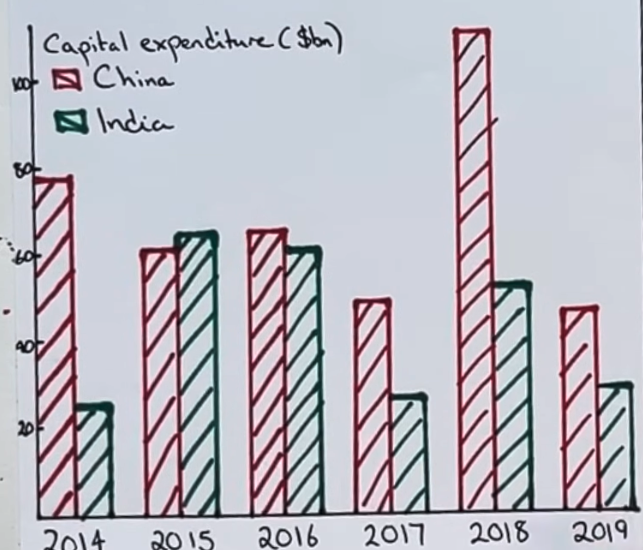
The bar chart shows the amount of foreign direct investment in India and China from 2014 and 2019.
Summarize the information by selecting and reporting the main features, and make comparisons where relevant.

Cut it into small pieces. Divide and Conquer. Describe accurately.
Introduction – Paraphrase the problem
The bar chart shows the amount of foreign direct investment in India and China from 2014 and 2019.
The bar chart shows = The chart illustrates
the amount of foreign direct investment =
the level of outside investment in the economies
in India and China from 2014 and 2019. = of India and China between 2014 and 2019.
The chart illustrates the level of outside investment in the economies of India and China between 2014 and 2019.
Overview – “Overall, [ruler method –> trend 1, trend 2]”
Ruler Method – put a ruler and try to match as many of the graphs as you can. That is general, overall trend.
Key – Look for 2 to 3 most obvious main features.
Overall,
Obvious trend 1 from Ruler Method:
trend 1 – expenditure in China declined steadily throughout the period but fluctuated in India.
Obvious thing 2 from Ruler Method:
trend 2 – Despite this, the total amount of money that flowed into China was higher than in India.
Overall, expenditure in China declined steadily throughout the period but fluctuated in India. Despite this, the total amount of money that flowed into China was higher than in India.
Details Paragraph
A – China

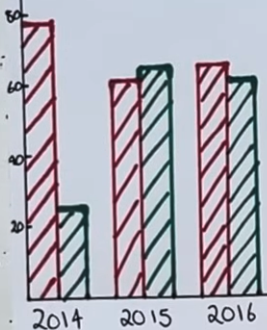
The Chinese economy received just under eight billion in 2014, which fell to around sixty billion in 2015 and 2016.

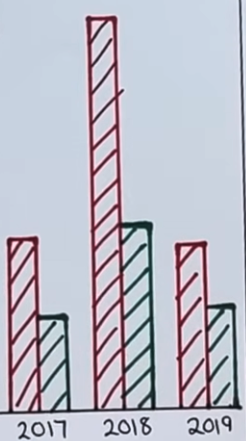
After a slight decrease in 2017, there was a massive resurgence to a high point of more than $100 billion in 2018 before receding to just over $40 billion in 2019.
B – India

In 2014, foreign outlays into India’s economy reached more than twenty billion, then rose significantly to approximately sixty billion in 2015 and 2016 before falling back to 2014 levels in 2017.

In 2018, there was another dramatic increase to just below sixty billion, before returning to around twenty billion in 2019.
Last paragraph – compare more specific data
2015 was the only year India’s investment exceeded that of China’s, with values slightly over sixty billion and values slight below sixty billion, respectively.
Use vocabulary to describe Data
steadily
decline
fluctuate
recede
resurge (resurgence)
rose significantly
reached more
dropped
fallen
increased dramatically
slightly over
approximately